The El Niño phenomenon: a model of global ocean disruption
By Jean-René VANNEY
L’Atlas Bleu / Exploring
El Niño, climatic disruption, oceanic phenomenon, devastating effect, South America.
With two maps and a graph, the article summarizes the principle of El Niño – a climatic disruption whose geographical amplitude and environmental implication are major at a world scale. The sequence of the phenomenon (whose frequency remains poorly known), that occurred in 1982-1983 on the coasts and off the coast of South America, is mapped and analysed specifically.
Extent of the phenomenon

The two diagrams, with an obvious exaggeration in scale, represent the vertical and longitudinal wave-like motions caused by the back and forth movement of the warm water layer (known as the ‘suprathermoclinal’ layer) during the course of the El Niño phenomenon, which occurs at intervals of several years.The map shows the average area covered by its route between the eastern (South American Pacific) and western (northern Australia) Pacific.
It is an exaggerated oscillation of a natural wave of heat and desalination (due to the convective rainfall it triggers) that periodically crosses the ocean. El Niño reaches catastrophic proportions when brought about by an exceptional forcing to the east. The amplified wave, shifted toward the west by the trade winds, is stored there for several months. A reversed wave, or return wave, then forms there that, by moving towards the east, gradually pushes the warm layer higher. This warm layer finishes by against the arid coast of America, where it spreads out, bringing equatorial rains, generally accompanied by catastrophic phenomena (see p.15). The last time such an event occurred was in 1998. Neither the frequency nor possible relationships of El Niño with global warming are presently known.
Principle of disruption

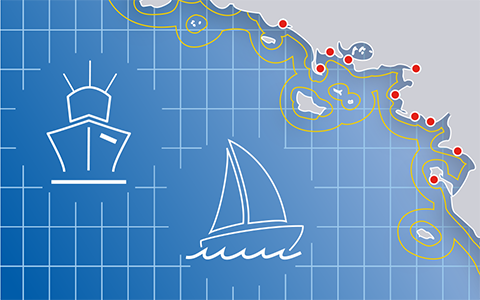
The El Niño event in 1982-1983, off South America

The penultimate oceanic catastrophe brought about by an El Niño event occurred in the south-eastern Pacific from the middle of 1982 to the end of 1983, with two peak phases (December 82-January 83 and March-April 83) with the following devastating consequences:
1) rise in surface levels (m): +0.50 (Peru), +0.40 (Galápagos), +0.25 (northern Chile);
2) rise in temperature: between 2° and 5°C above normal values;
3) thermocline deepening (up to 150 m in the Galápagos) and heat diffusion up to 1000 m;
4) reversal of the South Equatorial Current, powerful transfer of warm (29°-30°C) and desalinated water towards South American coasts;
5) unusually high rainfall offshore, torrential rain on arid coasts, reaching beyond the tropic;
6) coastal destruction: gullying due to runoff, cliff erosion due to waves, thermal and chemical degradation of coral reefs, etc.;
7) ecological disasters: stifling of coastal upwelling, coral bleaching, reduced primary production and biomass, massive fish mortality, biochemical pollution, exodus of marine birds and mammals, cold water fishery crises, prosperity of warm water fisheries.


Leave A Comment