Fishing resources: catches and food availability
By Julien NOËL
L’Atlas Bleu / Exploiting
Fishery resources, fishery, food fish consumption, disparity, world
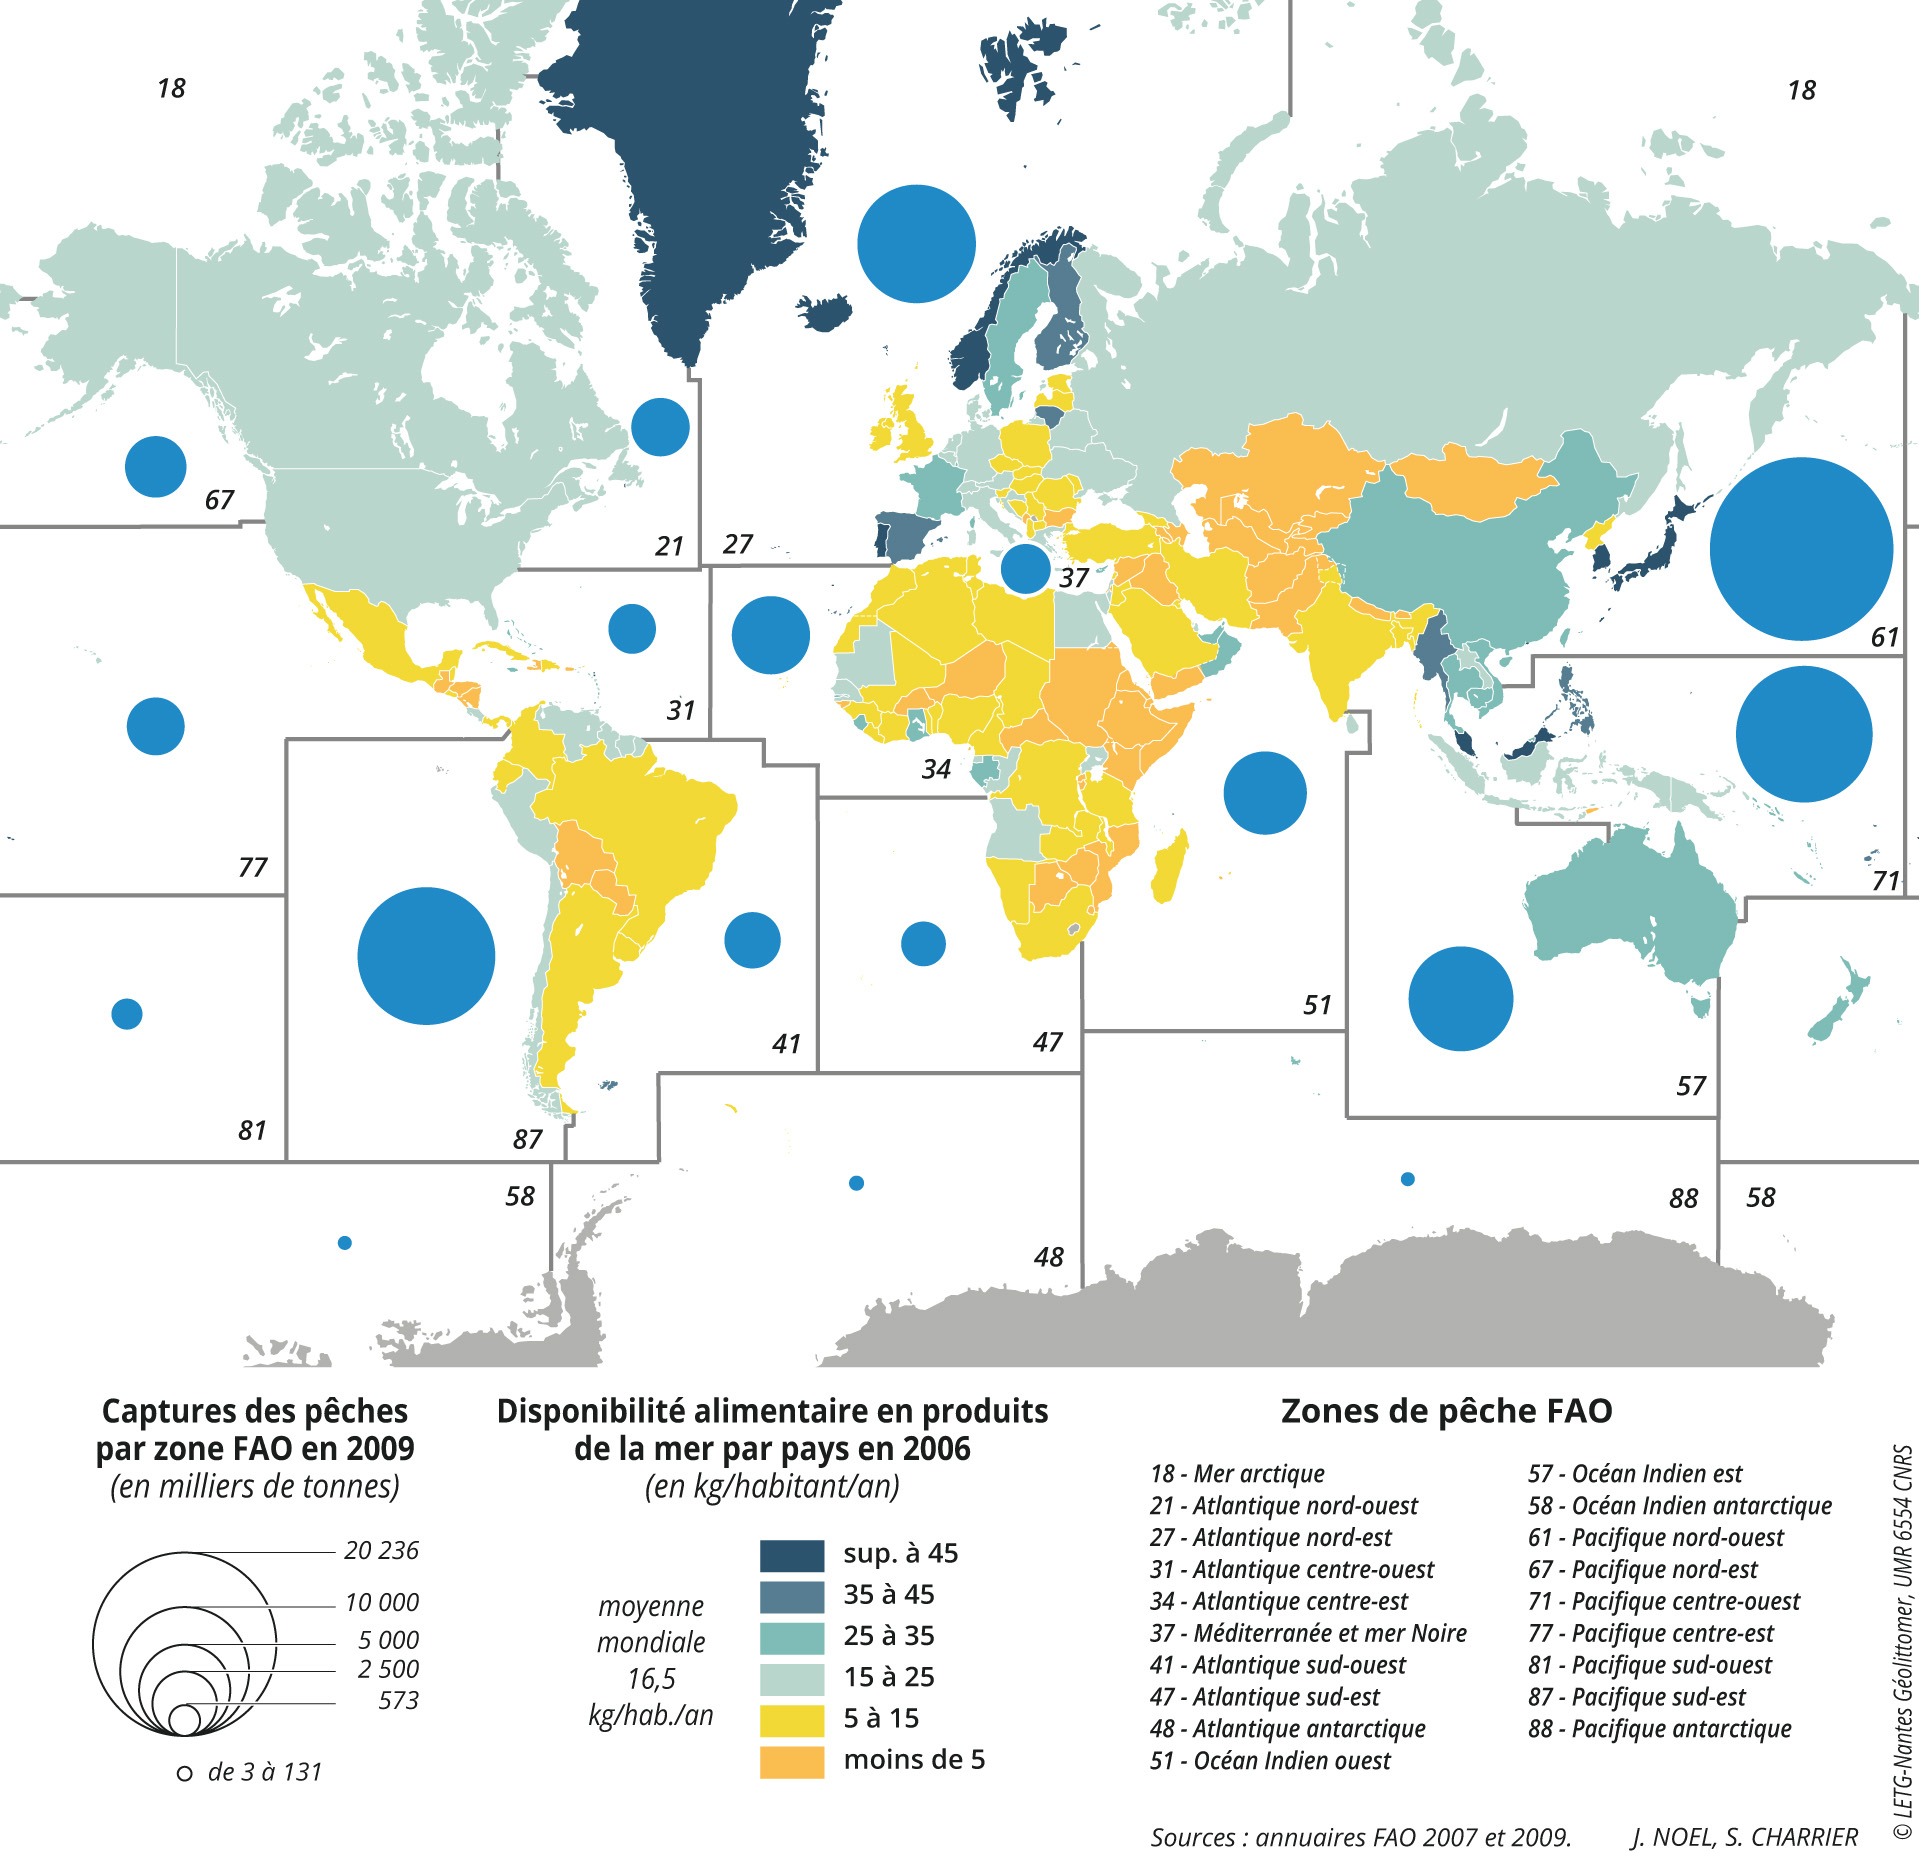
A map established on a global scale allows to compare the per capita food fish consumption by country and the fisheries catches of the adjacent ocean areas. North-South and inter-continental global disparities are highlighted and commented, revealing deep global imbalances in access to fishery resources.
Fishery catches by FAO area and seafood food availability by country (interactive map)
The location of major fishing centres shows a strong bias toward Asian countries, particularly the southeastern part of the continent, where half of the world’s catches (42 million tonnes, Mt) were concentrated in 2009 over four FAO sea-fishing areas (51, 57, 61 and 71). Fifteen of the top twenty producers are located here (including China, a giant in the sector, accounting for 14 Mt).
Nearby, two other regional centres stand out: zone 87, which is still being exploited by two industrial superpowers (Peru and Chile, 10 Mt), and zone 27, which is exploited mainly by northern European countries (Norway and Iceland), followed by western European ones.
Lastly, several historically high producing nations (United States, Russia) are still found at the top.
The distribution of food availability in terms of per capita aquatic foodstuffs reveals considerable inequalities, as illustrated by the high levels of fish consumption in countries of the Northern Hemisphere and Oceania compared with African and Latin American countries.
Yet, even though it is logical that coastal countries should have a higher per capita consumption than more continental countries, northern countries consume twice as much seafood as southern countries (28 kg versus 16 kg, whereas they account for only 20% of catches), importing aquatic proteins, which are increasingly traded and globalised.


Leave A Comment